NZD USD Price Technical Analysis Forecast
How High Can Kiwi Climb....
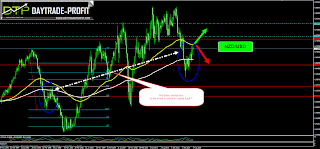
NZD/USD analysis, please pay attention to the charts – they could Tell the whole story The kiwi faced a downside pressure and closed bearish yesterday, the lowest trading price was marked at 0.7140. The resistance is at 0.7340, the support comes in at 0.7130. NZD/USD is trading higher after the FOMC rate decision, but the pair seems to be having trouble breaking long term resistance at 0.7340We have in The KIWI major event at Thursday August 11 201 - Official Cash Rate : the forecast is to decrease to 2.00 % from 2.25% Official Cash Rate they have now
 |
| kıwı dollar |
Let’s start with the simple stuff – support area and resistance long term support stay in 0.6940 while long term resistance locates in 0.7340
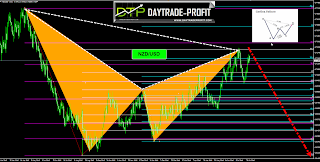
Pay attention to the pattern – it could be that we see here Gartley pattern, if this the situation so we should expect to see lower number below the last lows, while break above 0.7340-0.7460 could take him to 0.79 area
The NZD/USD might need to see further strength to move above the 0.7340-0.74400 resistance, which could indicate make new highs at 0.79 area, break below 0.6940+_ may expose what could be Another step down Below the previous lows key resistance area below the 0.6760 level
 |
| nzd usd |


No comments:
Post a Comment