Is this the next move in the markets, a hint of a stock that has already done so
Financial markets upcoming moves forecast update
In the previous post on the markets, I talked about the monster markets
I am covering those moves since 17,800 points on the dowjones+_ apx and suggest here the upcoming future move – The forecast materialized
 |
| markets forecast |
In the nine years since the outbreak of the global financial crisis of 2008, there has been panic in the markets. At the end of 2015 and the beginning of 2016, for example, it seemed for a moment that they were collapsing along with the Chinese stock exchanges, the price of oil and the European banks - but the recovery was very rapid.
Global growth, which we have not seen for many years, zero inflation and low-interest rates, together with expectations of an increase in corporate profits during the current reporting season, have led to money desperately seeking yields and continuing to flow into stock markets.
The Dow Jones Industrial Average, which is the 2008 crisis collapsed from 14,000 to 6,500 in five months, is currently at a record high of more than 23,000.
Did you know that there are shares that tainted more than 1000%, Yes Yes you heard correctly:
Stocks like Boeing and Home Depot have grown at amazing rates .....
 |
| markets moves |
In the year since the election, Trump has done nothing to support growth. Lots of intentions, lots of talks. Meanwhile, he has not been able to cut taxes and promote investment in infrastructure. However, he recently managed to pass the 2018 budget in the Senate. Trump is hard to decipher. The markets are a little euphoric about him and everyone is now waiting for the tax plan
But unexpected things can happen - for example about Trump's trade restrictions or the tax reform he has declared, which requires funding; What is not clear right now is how to finance this beautiful reform
In the United States, multiplier levels are rising all the time - that is, share prices are rising faster than companies' profits. All this happens in parallel to very low-interest rates and very moderate inflationary pressures.
However, it is forbidden to be complacent - and it is worth monitoring the activity of the central banks, noting that there is no situation in which inflation starts to rise faster than market expectations. The current chairman of the Fed, Janet Yellen, has raised interest rates so far at a slow pace - but its replacement, whose identity is still unknown, may adopt a policy of much faster interest rate increases. Today, the interest rate can be raised faster, because of the recovery in corporate profits and growth, and it is possible that the next Fed Chairman will decide to accelerate the pace.
Today, earnings reports from some of the leading US companies are published:
Google Amazon Microsoft and Intel: It will be very interesting to see how the market will react to earnings reports and whether the rally will continue...
Technical analysis on the dow :
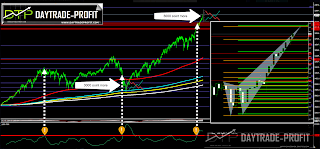
Do you all remember the chart and pattern I raised at the time in 2016 forecast:
The goals have long been achieved one by one, now if we look at the pattern again, we will notice that it becomes deep crab This pattern is valid when price respects and bounces off of the XA swing high swing low to form point B at the 88.6% Fibonacci retracement level. The target of point D is beyond the origin of XA and is 1.618 of XA – now if we will look the chart again so we can more distant goals, which can be derived and derived from deepening the pattern, are in areas of price levels such as 23,300+_ and even more high at 24,600-25,100 price area ,while the opposite direction can cause the dow jones to move lower to test crucial areas in 22,100-22,400 - those levels seem to have strong support .one more thing for finish is to test one indicator - as you can see in the chart only one time in the past, he breaks up the red line (extreme situation) -this movement was in 2008 and bring more 3000 points from the break, so, if we will go now those days, its give us the same target as I mention above apx 24,000 +
 |
| markets collapse |
Now let's go to check the interesting things that caught my eyes :
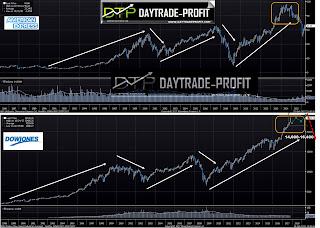
focus on the stock that may be the one that shows us what will happen next….and this stock is AXP – American express - just look and tell me what you see
above is the DOW JONES and below is AMERICAN EXPRESS so far so good right
Well, why am I showing you those charts - because if we will take the trends in AXP we can see in 2015 the fast collapse from 96$ +_ price area to almost 50$
my guess is that the same move will appear on the DOW JONES when the decline will come, but first, we need to wait for some clues or evidence before start making shorts, for my opinion Right now I think in terms of risk and chance of investing long in the markets The potency is limited
 |
| dow jones vs stocks |
This review does not including any document and / or file attached to it as an advice or recommendation to buy / sell securities and / or other advice


No comments:
Post a Comment