Has the weakness in the indices faded and returned to a new high
Markets analysis
Let's look at what's going on right now current chaos in the markets
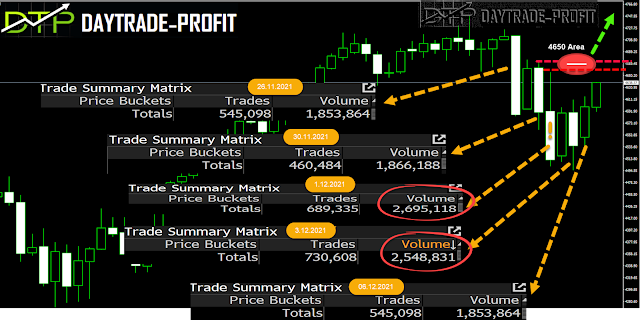
We will examine what happened to the indices since the beginning of the declines on 26.11.2021
I took for example the most negotiable contract in the world which is for the SP500
 |
| S&P analysis |
26.11
Beginning of the decline - average volume - critical points of trading were made at a price level of 4610
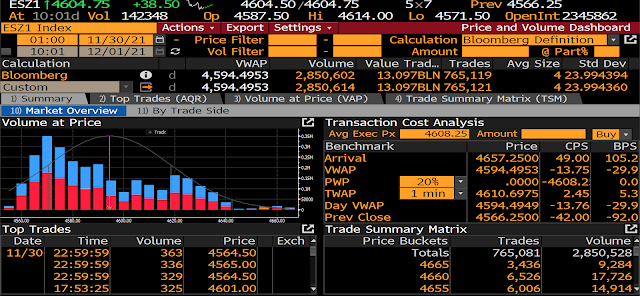
30.11
Continuation of the decline - average volume - critical points of trading was made at a price level of 4560
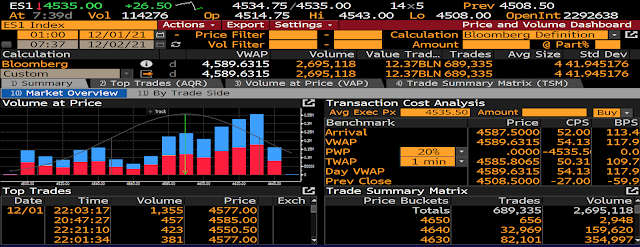
1.12
Large trading range in combination with high volume, examination of the high area of the previous day in area 4650 and then continuation decline - average volume - critical points of trading was made at a price level of 4580 - a critical day in terms of price and volume combinations
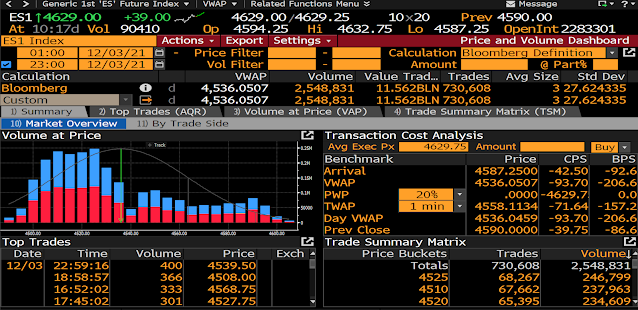
3.12
currently appears to be below for the current downtrend - combined with high volume
Critical points of trading were made at the low price levels of 4520
6.12
Gap opening at the beginning of the trading week, closing the gap and running strong up
Average Volume - Critical points of trading were made at a price level of 4580
in my opinion - the danger will pass only when the price closes a day above 4650 Points


No comments:
Post a Comment