Markets Are Going Down aggressive, Will it be over soon, or we are witness new era for the markets
Markets Are Going Down , when it will stop ?
The signal is given at the top of the indices - another proof that the Technician works for someone who doubts
Have the market's indices reached a saturation point and thus begin to release pressure?
"" according to the sentiment and the graph, we are on the edge and therefore I think this is the point in which it is worth trying to check whether it will work
I am talking about trading, of course, on the indices when I assume that the markets are in the process of correcting whether I am healthy or not yet know
But patch down almost certainly - with a probability of more than 70%
Let’s build a test strategy
Short position with a stop of 3-4% and profit 7-8%
A ratio of 1: 2 in terms of chance of risk"
 |
| markets technical analysis |
" Notice the ascending configuration of the graph, as well as the bottom oscillator 2008 when it reached extreme levels - the market made an opposite move
So we saw declines and the day is rising but what is interesting is the strength and the ability of the market to attract moves of strong movements"
In my opinion, at the moment, the move we envisioned last week is a correction, and nothing more
Only when critical levels of the indices break down will we be able to say that we are entering a new trend and it is still far
What is - at the moment the situation is such that my personally shows 3 options
A. Finish the correction of another 1 + _% down and then back up to continue the bubble move
The correction continues to fall to critical levels (+ -3-4% from last week's closing levels) and back to the top
third. Entering a Bear Market If critical levels are in place, what will not be seen at this stage is broken
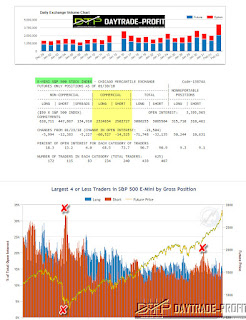
Looking at a position map of the tradable asset in the world SP 500 - e mini sp500
You can see several things
Last Friday's trading volume was very high!
Fuzhou grew last week
Another point is a spatial view of the course of the index against the positions of the traders - you can clearly see the peak and the lows in the positions against the movement of the index positions short at the peak and long at the low - what happens to the index = it is reversed and vice versa is the secret - 95% ...
 |
| e mini sp500 |
Technical analysis
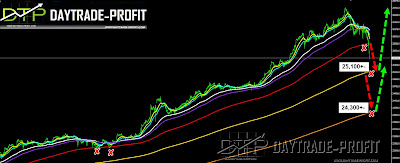
look the chart again so we can more distant goals, which can be derived and derived from deepening the pattern, are in areas of price levels such as 25,100-25,300 price area, while break those levels can cause the dow jones move lower to test crucial areas in 24,100-24,400 - those levels seem to have strong support .one more thing to finish is to test one indicator - as you can see in the chart only one time in the past, he breaks up the red line (extreme situation) -this movement was in 2008 and bring 45% move from the break
 |
| Dow jones analysis |
Nasdaq 100 technical overview is look more or less the same: areas of price levels such as 6620-6640 price area, while break those levels can cause the NASDAQ move lower to test crucial areas in 6470-6500 - those levels seem to have strong support
 |
| NASDAQ analysis |
This review does not including any document and / or file attached to it as an advice or recommendation to buy / sell securities and / or other advice


No comments:
Post a Comment