is U.S. Markets Selloff Signifies the arrival of the bears ?
Stock Markets Technical analysis
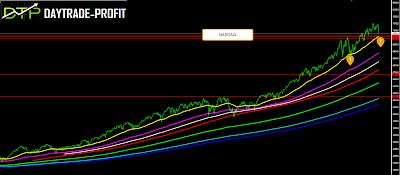
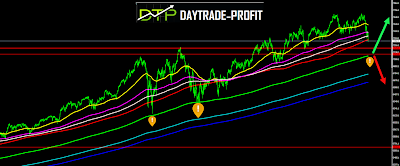
SP 500 NASDAQ and DOW JONES drop down hard after settled new record, are we going to get a false breakout or its only a healthy correction for the last move -The markets set new highs after the big correction at the beginning of the year, where are they headed from here?Looking at the NASDAQ index you can see that the index shows extraordinary power because he broke his record long time before the other indexes, but from the other hand he shows also the big volatility moves in the markets when downtrend comes
in January this year, I talked about the upcoming correction in the markets - it comes to the big drop earlier this year –was expected!
The long-term forecast could suggest even more upside on the index - last February post shows very interesting ideas
 |
| markets analysis |
Technical analysis view
One can see the clear convergence, which was one of the declines that began in January an examination of the level of resistance, buyers versus sellers is reflected well on the price graph of the index In my opinion, in May, the beginning of the real recovery can be seen very well. What now? As I said, and from the technical perspective, the level of support can be clearly seen in the previous peak area at the beginning of the year, when I think that the main level lies in the price level of 7100+- point area - its the key point. The continuation of the move moves towards high price levels and creating new highs
 |
| NASDAQ Analysis |
as i wrote the last post I estimated if the index can continue based on the graph - based on technical indicators only at the moment - an average track of price behavior can show us something interesting:
The previous crisis that experienced an index in 2007-8 can be seen as the last move that was very bullish and with a strong right angle, but this is not the focus of the matter at the moment - the focus is precisely on the escape from the framework of the moving averages,
Pay attention to the yellow strip, and the last move in 2007, in the case of today - 2018, which will probably continue into 2019, suggesting that the target is currently 8600 + _ points
There we will check the index again and evaluate the situation again
 |
| stock markets analysis |
This review does not include any document and/or file attached to it as an advice or recommendation to buy / sell securities and/or other advice


No comments:
Post a Comment